1. Objective
Preventing customer churn is a very important matter for a company, as understanding why customers are leaving allows to make better decisions. Moreover, acquiring new customers can be more expensive than keeping old ones.
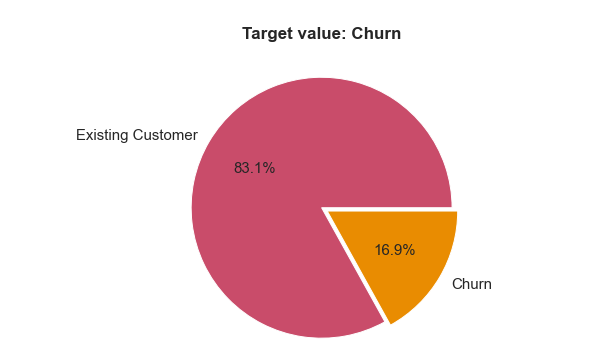
TThe goal of this project is to understand why customers may want to leave the company and to train an ML model that can predict which customers are likely to churn.
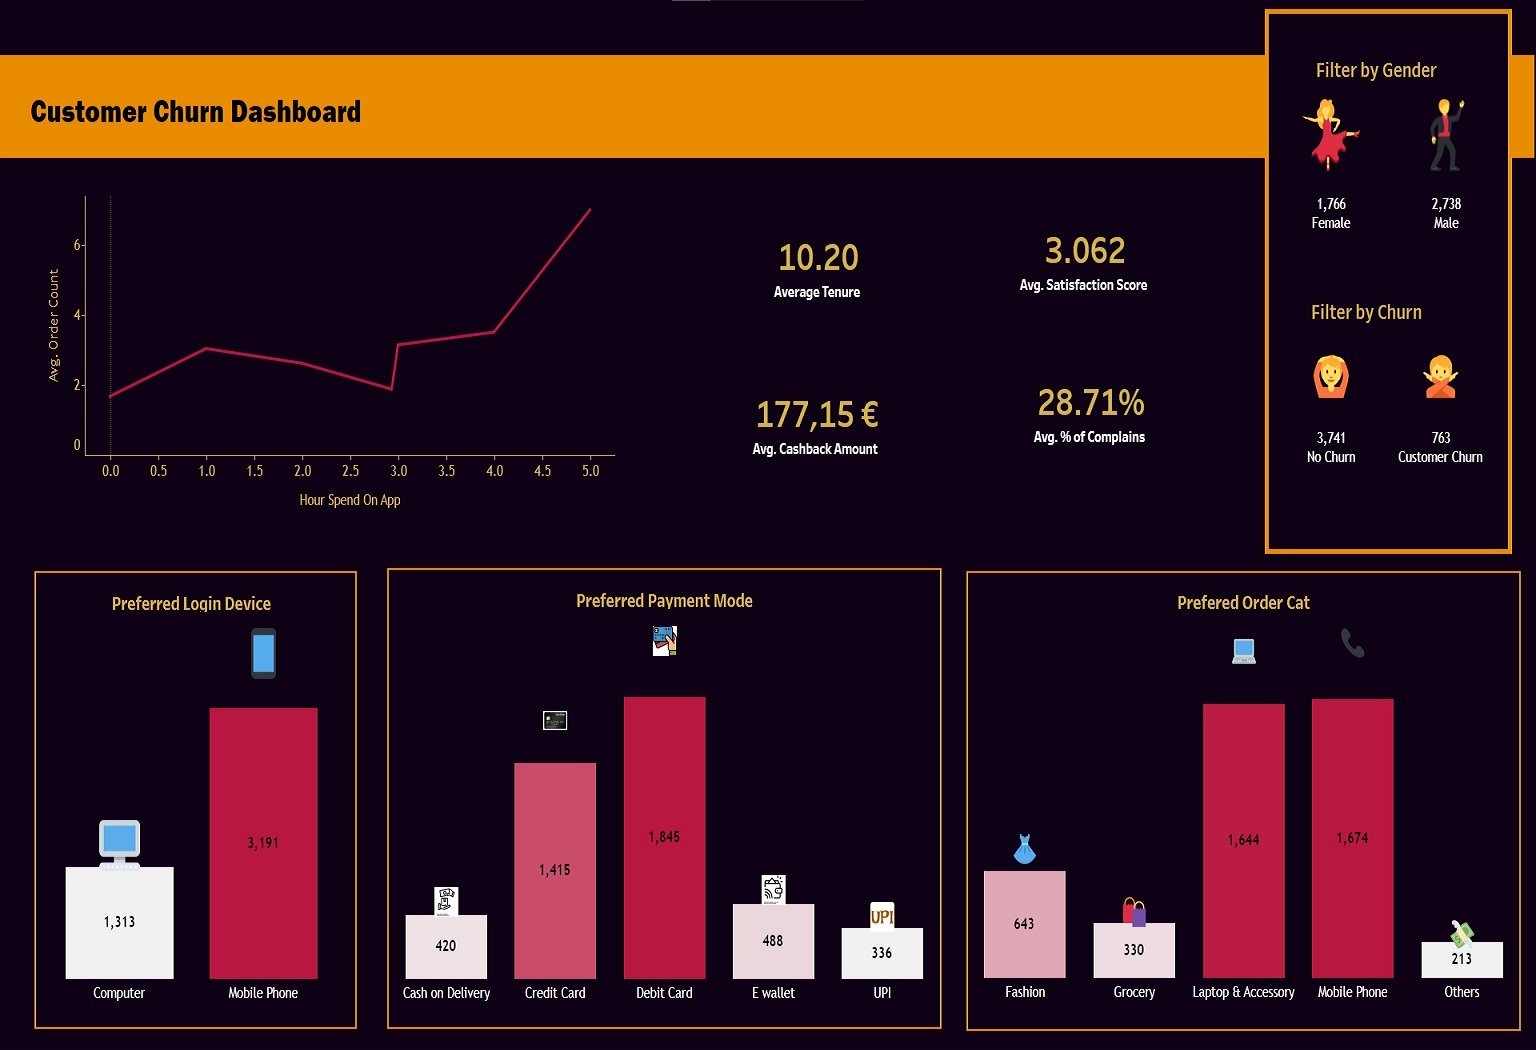
In this project, I use data from an e-commerce company available on Kaggle, which contains information on genre, tenure, preferred payment mode, and more, for over 5,600 customers.
2. Results
From the conducted analysis, we can conclude the following things:
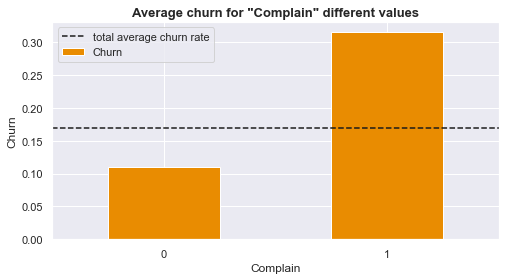
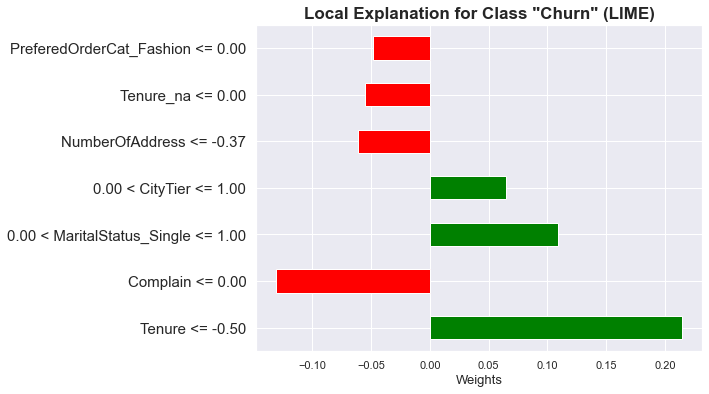
- Customers are more likely to churn when they have not been with the company for a long time (tenure is low) and when there have been complains.
- Moreover, it seems that single people are also more likely to churn, as well as people from certain city tiers
- However, customers who mostly purchase from the "Laptop & Accessory category" are less likely to churn
The company should try to better focus on single people, study why certain categories are associated with a higher risk of churn, as well as see why certain city tiers are more susceptible to churn. In addition, understanding where complaints are coming from could also be helpful. By addressing these factors, it is likely that the churn rate will decrease.
3. Overview
# Preprocessing
- Analysed the data (distributions, type of data, missing values) and studied the relationship between the features and the average churn rate of the e-commerce
- Preprocessed the data to be able to apply a machine learning model
- Used SMOTE to handle imbalanced data
# Modeling
- Studied more than 10 classification algorithms, from simple models like Logistic Regression to ensemble methods like Random Forest or XGBoosting as well as combinations of models using Voting classifiers and Stacking classifiers
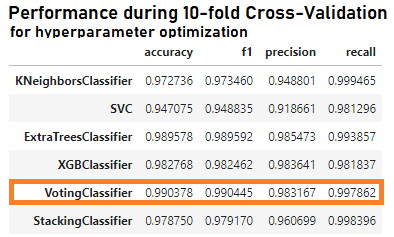
- Optimized hyperparameters of the best performing models using 10-fold cross validation
- Combined the finetuned models using a Voting Classifier and a Stacking Classifier
- Built a pipeline able to preprocess and predict on new data using a fine-tuned pickled model
- Used LIME to interpret results
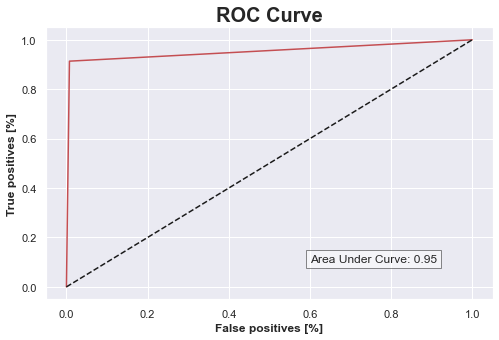
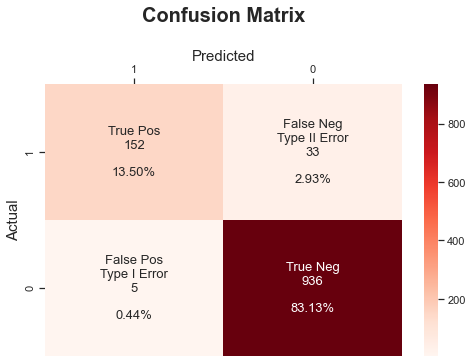
- Achieved high performance on test data using a Voting Classifier on previously finetuned models:
| Models | Accuracy | Precision | Recall |
|---|---|---|---|
| Voting Classifier (best overall model) | 97.96% | 96.02% | 91.35% |
| Extra Trees Classifier (best individual model) | 96.63% | 96.82% | 82.16% |