Regression - Time-Series
Sales Analysis and Forecasting
1. Objective
Analyzing past sales and being able to forecast future sales are two very important processes for any business, as they allow companies to make better data-driven decisions.
The objective of this project is to gain insights from the data and forecast sales
For this, I use time-series data (Jan 2013 - Jul 2015) from 1115 different stores of the "Rossmann" chain, as well as additional data related to the stores (available on Kaggle).
Note: this data was originally used in the context of a Kaggle Competition from 2016
2. Data Analysis
Data exploration was done using Python but the main analysis of the data was done using Power BI and the results are available as a report.
Before starting the analysis, a few dimensions to analyze sales were selected:
- Does time have an impact on sales? (e.g. seasonality)
- Do promotions increase sales?
- Does stores sales performance vary by state?
- What characterizes the best and worst performing stores?
From analyzing the data, the following insights were found:
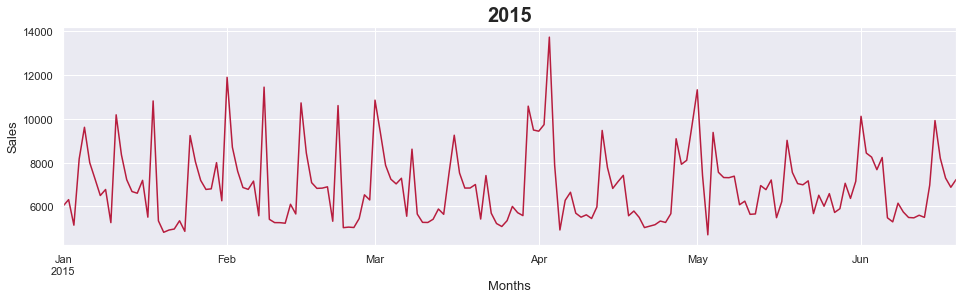
2.1 Time
- Total sales declined between 2013 and 2014 mostly because there are no registered sales from stores in Bavaria in the second half of 2014. This is one of the states that usually have the most sales, and thus, this really impacts global performance.
- Total sales in 2015 (data available from January through July) have already exceeded 2014 sales, and average sales increased between 2013 and 2014 and between 2014 and 2015.
- Finally, as expected, total and average sales are higher in December.
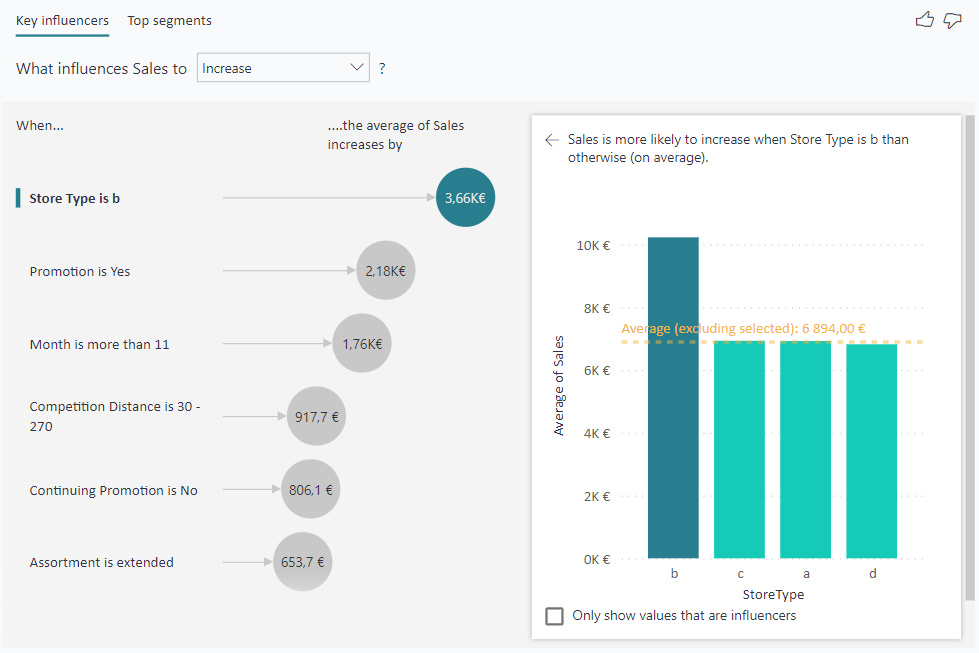
2.2 Promotions
- Promotions have a mixed effect on sales. Normal promotions running in a given day seem to increase sales, but ongoing promotions seem to be associated with lower sales.
- In addition, on average, Type "B" stores, which are less frequent and have higher average sales, are the most negatively affected by these ongoing promotions.
Further analysis and additional data are needed to understand why ongoing promotions lower sales.
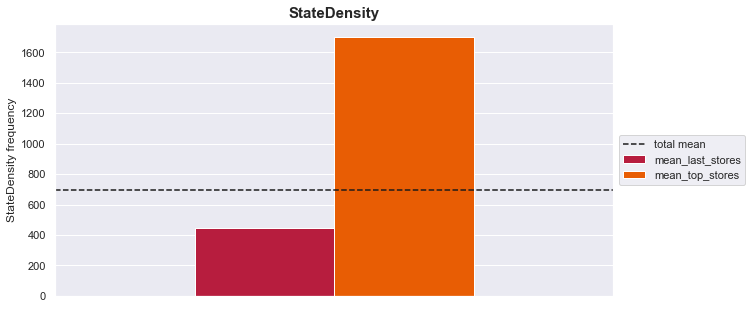
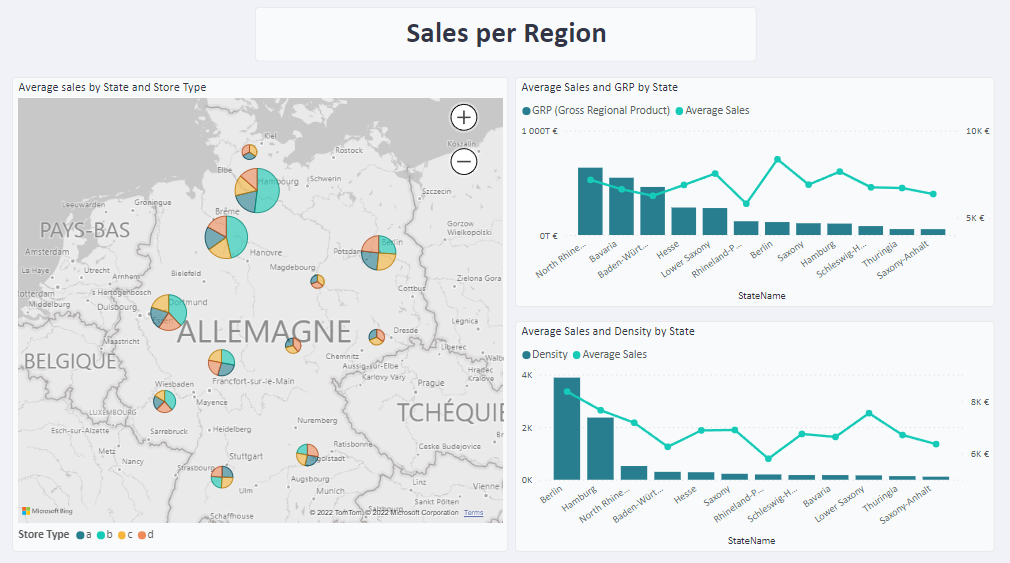
2.3 States
- There is no clear trend between average sales and States Density or Gross Regional Product (GRP), although there seems to be a small positive correlation.
- The highest average sales are in the two more dense states: Berlin and Hamburg, and the top 4 state is also the one with the highest GRP (North Rhine-Westphalia)
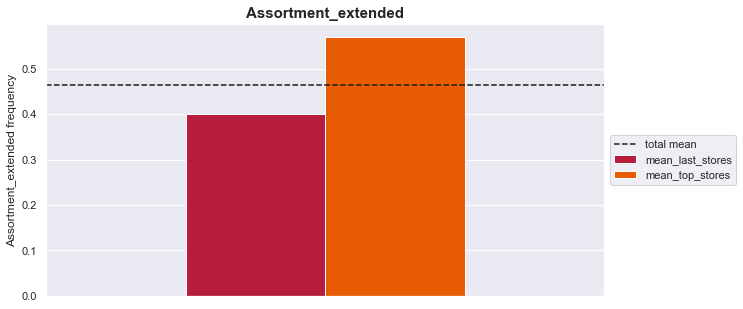
2.4 Stores
- As mentioned before, the highest average sales come from "B" type stores. There are only 17 stores of this type among the 1115 total, and 5 of them are in Berlin.
- On average, stores with an "Extra" assortment have higher sales. The "Extended" type of assortment also seems to increase sales, specially in stores of type "B".
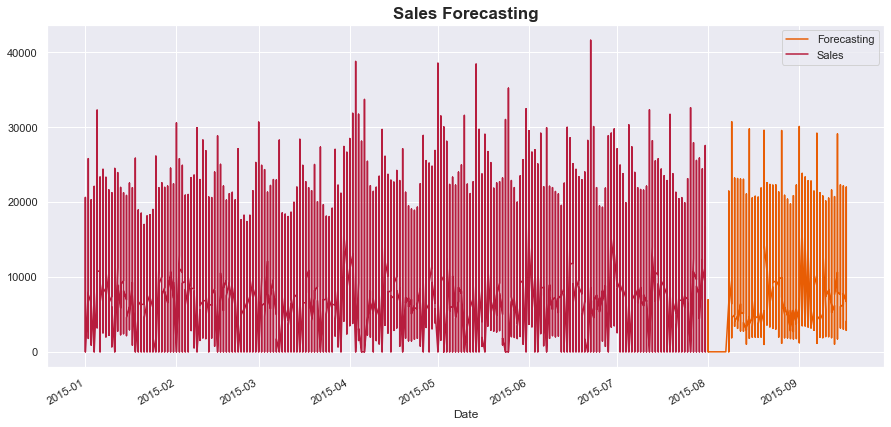
3. Forecasting Model Results
The final model is a RandomForestRegressor with a R2 = 0.903, a RMSE = 960 and a MAE = 646 (based on performance on validation set)
Test on Kaggle Competion (late submission)- As recommended (source), before submitting I scaled back sales which did not impact other metrics besides the RMSPE, which decreased
- The model gets a public score of 0.11861 on a fraction of the test data, but a final score of 0.13248 on the total of the test data which indicates some overfitting (best final score in competition: 0.10021 --Leaderboard)
4. Process
# Preprocessing and EDA
- Conducted an exploratory data analysis using Python to be able to better understand the data and clean it for future forecasting
- Applied an Adfuller statistical test to verify stationarity
- Studied differences between the best and worst performing stores on Python
- Recreated the preprocessing steps on Power BI using M and DAX, then conducted further analysis
# Modeling
- Explored different tree-based models and fine-tuned hyperparameters on the best peforming models using 3-fold cross validation with time series split
- Applied a preprocessing pipeline to clean validation set to evaluate model performance
- Visualized feature importance as well as interpretations with LIME (Local Interpretable Model-agnostic Explanations)
- Cleaned and predicted on test data from competition then applied a late submission with final RMSPE score of 0.13248